Dive into Splunk
Carasso
Splunk's Chief Mind
The purpose of the document is to very quickly get you up and running with
Splunk on your laptop or desktop, to the point that you fall in love.
What is Splunk?
It’s software.
You download Splunk, you install it somewhere sensible. People at
your company use it to search through massive amounts of IT data. You can
install it on your laptop, or on a server or on a thousand servers. You use it through your browser but
your data’s never public.
Why would I? What’s
the problem I’m having again?
There’s an enormous amount of live data from your IT systems
that people in your company have to sift and wade through every day.
Doing that is time consuming, brittle, stressful, and a huge pain in the
ass.
How can Splunk help me
with this problem?
At the simplest level, Splunk gives you a single interface
to search, report, and alert on all your IT data, across your entire IT
infrastructure.
Splunk can be
applied to any unstructured data, and people use it for things as diverse as
web analytics, telecoms call records, and earthquake data. On the fly you can
assemble search results into larger and more familiar concepts like ‘ip
addresses’ or ‘failed transactions’, and from there you can calculate
statistics and email people pretty charts.
Sounds like its expensive
or it takes weeks to set up.
There’s a free license. It installs in 15
minutes. On your
laptop, while you’re testing it out, search billions of events in seconds. When you’re ready, scale up to your
datacenter and search trillions. Basic
searching and quite a lot of the reporting will work right out of the box.
Bullshit.
Well I’m not saying that 15 minutes in, it’s going to be
emailing your boss a pdf pie chart of “lost revenue – top causes”. But
that’s seriously possible in a couple of hours. Out of the box, Splunk will parse your data and extract out a
lot of meaning, and if it doesn’t get everything, teaching it how to extract
the juicy numbers and names from your events is really pretty
straightforward. Then, once all
the numbers and names are extracted and ready to be reported on, you’ll be able
to do real searches and reports that help your people solve real problems. And when you get to that point, from
then on it’s pretty much crack. My
goal in this document is to get you addicted. Sorry.
Download Splunk for free and try it for yourself from splunk.com, right now.
Now we’ll
cover a quick overview of installing Splunk on your personal machine so you can
try it out. To know the real
nitty-gritty of each platform, deploying in a multi-machine architecture, and
for anything more complicated than hitting "Next", go to http://docs.splunk.com and click on
Installation Manual.
Minimum Requirements
Platforms: most flavors of Windows, MacOSX, and Linux, as well as specific
FreeBSD and AIX versions.
Supported web browsers: most versions of Firefox, Internet Explorer, and
Safari.
Hardware: basic rule: don't have a crap machine. Crap machines equal crap experience. A $1000 Windows laptop or a $2000 Mac
laptop is good enough to try things out.
When you're really ready to deploy Splunk, you'll want multi-core
machines with 8GB, fast disks, and 64-bit OS. If you've got Windows95 on a 1MB x486, please go away.
Licensing
When you download Splunk for the first time, you get all of the Enterprise
features of Splunk for 60 days and you can index up to 500 megabytes of data
per day. At anytime you can convert to a perpetual Free License or purchase an
Enterprise License to continue using the expanded enterprise functionality,
namely: multiple user accounts, distributed architecture and deployment for
greater scaling, summary indexing for faster reporting, and scheduled searches
and alerts.
Installation
Below we'll briefly walk-through the graphic installers for Windows and
MacOS. For commandline
installations, installations on other platforms, or if you encounter problems,
refer to the Splunk installation manual.
Windows
The Windows installer is an MSI file.
1. To start the installer, double-click
the splunk.msi file. The Welcome
panel is displayed. To
begin the installation, click Next.
2.
Accept the license agreement. We're nice people. Click Next.
3.
Enter the requested information on the Customer
Information panel. Click Next.
4.
The Destination Folder panel is displayed. By default, splunk is installed into
the \Program Files\Splunk. Click
Change, to specify a different location to install Splunk. Click Next.
5.
The Logon Information panel is displayed. Splunk installs and runs two Windows
services, splunkd and splunkweb.
These services will be installed and run as the user you specify on this
panel. You can choose to run
Splunk with Local System credentials, or provide a specific account. The user Splunk runs as must have
permissions to: Run as a service, Read whatever files you are configuring it to
monitor, Collect performance or other WMI data, and Write to Splunk's directory
– that’s usually your Domain Admin account.
6.
Select a user type and click Next.
7.
Click Install to proceed. The installer runs and displays the
Installation Complete panel.
8.
Check the boxes to Start Splunk and Start Splunk
Web now. Click Finish.
9.
The installation completes, Splunk starts, and
Splunk Web launches in a supported browser.
MacOS
Below are instructions for the Graphical installation using the DMG file:
1. Double-click on the DMG file. A Finder window containing splunk.pkg
opens.
2.
In the Finder window, double-click on
splunk.pkg. The Splunk installer
opens and displays the Introduction.
Click Continue.
3.
In the Select a Destination window, choose a
location to install Splunk. To
install in the default directory, /Applications/splunk, click on the harddrive
icon.
Refer to the installation manual for uninstalling. Tarzan sad.
Starting up Splunk
Splunk can run as any user on the local system, but you’ll obviously want to
make sure that that user has access to the data you want to use.
Windows
You can start and stop the following Splunk processes via the Windows Services
Manager:
· Server daemon: splunkd
·
Web interface: splunkweb
MacOS and Windows
You can start Splunk by opening a shell and going to the $SPLUNK_HOME/bin
directory, where $SPLUNK_HOME is the directory into which you installed Splunk
(on windows $SPLUNK_HOME defaults to "\Program Files\Splunk"), and
typing in:
$ splunk start
You can stop or restart Splunk similarly:
$ splunk stop
$ splunk restart
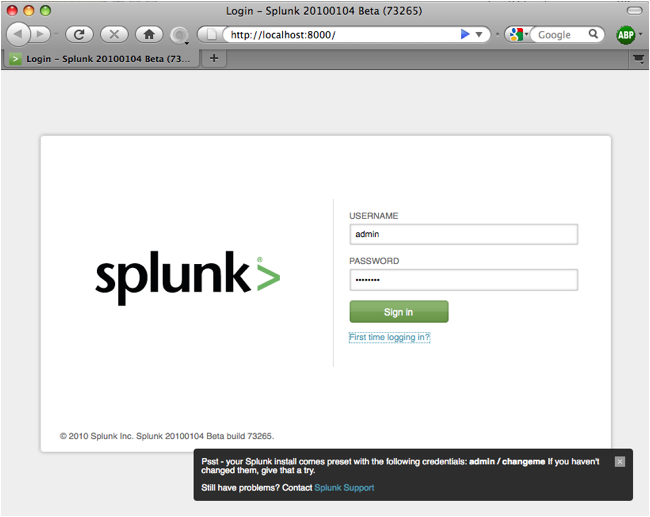
Access the Web Interface
After you start Splunk and accept the license agreement, access the Splunk web
interface at
http://localhost:8000
If you're not running Splunk on same machine as you’re browsing on, or if
you’re using a different port than the default (8000), change the values as
necessary.
Log in
If you're using the free license, there will be no logon page; otherwise, login
with the default username ("admin")
and password ("changeme").
In this
chapter, we're going on our first dates with Splunk. We're going to add some data into Splunk, make some
searches, and generate some reports.
We'll base the examples on publicly available example data. After you read this document, you should
try it with your own data. It's
one thing for Splunk to look pretty in a $500 dress, but when she looks good
wearing your old Atari t-shirt, you know she's special.
Basic Concepts
There
are a few concepts in the Splunk world that will be helpful for you to
understand. I’ll cover them in a
few sentences, so try to pay attention.
If you want more details, see the “Concepts” section near the end of
this document.
Processing
at the time the data is processed: Splunk reads data from a source, such as a file or port, on a host (e.g. "my machine"),
classifies that source into a sourcetype (e.g., "syslog",
"access_combined", "apache_error", ...), then extracts
timestamps, breaks up the source into
individual events (e.g., log events,
alerts, …), which can be a single-line or multiple lines, and writes each event into an index on disk, for later retrieval with a search.
Processing
at the time the data is searched: When a search
starts, matching indexed events are
retrieved from disk, fields (e.g.,
code=404, user=david,...) are extracted from the event's text, and the event
is classified by matched against eventtype
definitions (e.g., 'error', 'login', ...). The events
returned from a search can then be powerfully transformed using Splunk's search language to generate reports that live on dashboards.
Adding Data
Splunk can eat data from just about any source, including files, directories,
ports, and scripts, keeping track of changes to them as they happen. We're going to start simple and just
tell Splunk to index a particular file and not monitor it for updates:
1. In your browser, go to http://innovato.com/splunk/websample.log, and save the file onto your
desktop.
2. Go
to the Splunk Web interface (e.g. http://localhost:8000) and log in, if you
haven’t already.
3. Click
Manager in the upper right-hand corner of Splunk Web.
4. Under
System configurations, click Data Inputs.
5. Click
Files and directories.
6. Click
New to add an input.
7. Choose
Upload a local file
8. Browse
and find "websample.log" on your Desktop that we previously saved.
9. Accept
all the default values and just click Save.
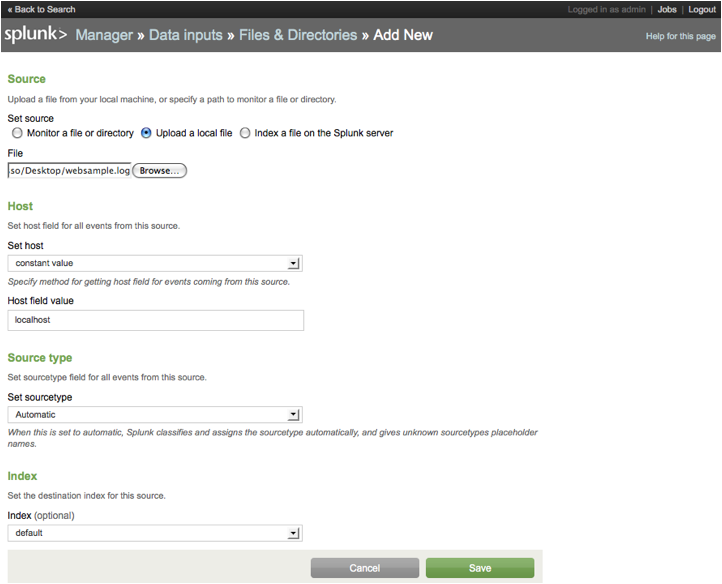
Assuming all goes well, websample.log is now indexed, and all the events are
timestamped and searchable.
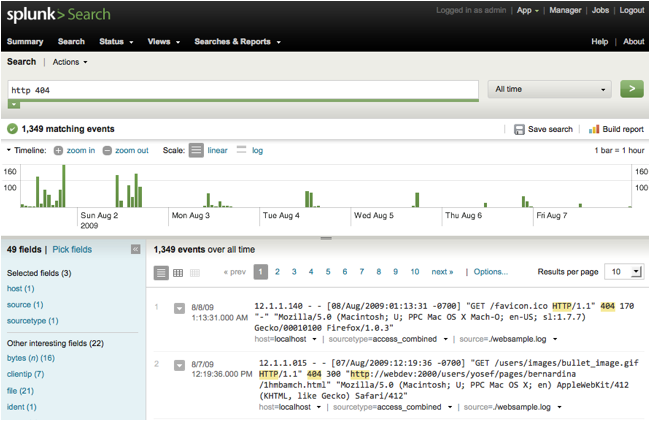
Basic Searching
Splunk comes with several Apps, but the only relevant one now is the 'Search'
app, which is the interface for generic searching. (More apps can be downloaded and advanced users can built
them themselves.) After logging
into Splunk, select the Search app and let's get started in searching. We'll start out simple and work our way
up.
To begin your Splunk search, type in terms you might expect to find in your
data. For example, if you want to
find events that might be HTTP 404 errors (i.e., webpage not found), type in
the keywords:
http 404
You'll get back all the events that have both HTTP and
404 in their text.
Notice that
search terms are implicitly AND'd together. The search was the same as "http AND 404". Let's make the search narrower:
http 404 "like gecko"
Using quotes tells Splunk to search for a literal phrase “like gecko”, which
returns more specific results than just searching for “like” and “gecko”
because they must be adjacent as a phrase.
Splunk
supports the Boolean operators AND, OR, and NOT (must be capitalized), as well
as parentheses to enforce grouping.
To get all HTTP error events (i.e., not 200 error code), not including
403 or 404, use this:
http NOT (200 OR 403 OR 404)
Again, the AND operator is implied; the previous search is the same as
http AND NOT (200 OR 403 OR 404)
Splunk supports the asterisk (*) wildcard for searching. For example, to retrieve events that
has 40x and 50xx classes of HTTP status codes, you could try:
http (40* OR 50*)
Wildcards can appear anywhere in a term, so "f*ck" will return all
events with fack, feck, fick, fock, or flapjack, among others. A search for “*” will return all
events. Note that in these
searches we’ve been playing fast and loose with precision. Any event that has 50 in it (e.g.
“12:18:50”) would also unfortunately match. Let’s fix that.
When you index data, Splunk automatically adds fields (i.e., attributes) to
each of your events. It does this
based on some text patterns commonly found in IT data, and intermediate users
can add their own extraction rules for pulling out additional fields.
To narrow results with a search, just add attribute=value to your search:
sourcetype=access_combined status=404
This search shows a much more precise version of our first search (i.e.,
"http 404") because it will only return events that come from
access_combined sources (i.e., webserver events) and that have a status code of
404, which is different than just having a 404 somewhere in the text. The “404” has to be found where a
status code is expected on the event and not just anywhere. In addition to <attribute>=<value>,
you can also do != (not equals), and <, >, >=, and <= for numeric
fields.
Splunk's search language is much more powerful than you think it is. So far we've only been talking about
'search', which retrieves your indexed data, but there are dozens of other
operations you can perform on your data.
You can "pipe" (i.e., transfer) the results of a search to
other commands to filter, modify, reorder, and group your results.
If Google were Splunk, you'd be able to search the web for every single page
mentioning your ex-girlfriends, extract out geographical information, remove
results without location info, sort the results by when they were written,
keeping only the most recent page per ex-girlfriend, and finally generate a
state by-state count of where Mr. Don Juan's ladies currently live. But Google isn't Splunk, so good luck
with that.
Note: In all the following examples
we assume that you have only indexed the websample.log web data, which we added
from the previous chapter. If you
have more data in your Splunk instance, you should prefix all examples with
“source=*websample.log” so we’re experiencing the same thing. We took it out to make each example
more concise.
Let's do something similar, though, with our web data: let's find some
interesting things about URIs that have 404s. Here's our basic search:
status=404
Now let's
take the result of that search and sort the results by URI:
status=404 | sort - uri
That
special "pipe" character ("|") says "take the results
of the thing on the left and process it, in this case, with the 'sort'
operator".
Unfortunately,
you probably can’t see many of the great fields Splunk has extracted, such as
URI. Let’s fix that. In the blue smurf-like area to the left
of the search results, click on "Pick fields" to open the Fields
popup window, and add interesting fields.
You can add just click “Add all”, or selectively pick a few good ones. I’ve added bytes, referer_domain,
status, uri, and useragent. Click
Save. Beside each result, you’ll
now see the fields that were previously hidden, and you can verify that the
select which fields show up on your search results.
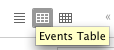
Click on
the Events Table icon, just above the results and towards the left, to view a
more tabular representation, which might make things more clear.
But we
don't just want a list of these things; we want a report that tells us the
worst offenders:
status=404 | top 5 referer_domain
This uses
the "top" command to give us an ordered list of the top 5 most common
referer_domains, along with a count and percent. Basically this is a list of the sites that have pointed the
most traffic to bogus pages. Bad
referer_domains, bad dog.
Some times it's useful to run a filter search to remove results after some
processing has happened. In our
case, suppose we want to take the previous results and just show the
referer_domains that have directed someone to a bad page more than twice:
status=404 | top 5 referer_domain |
search count>2
OK math geeks, supposing you want to calculate a new field based on other
fields, you can use the 'eval' command.
Let's make a new field kbytes, on the fly, based on the bytes fields:
* | eval kbytes = bytes/1024
And now for something completely different: assuming you had indexed data from
a dating site, search for the smartest girl of each
hair and eye color variation, calculating her bmi:
gender=female |sort -iq |dedup hair,
eyes |eval bmi=weight/height
No hate mail.
We've just
shown you a tiny, tiny window of what is possible in a Splunk search. See the Appendix for a quick cheatsheet
of search commands and examples.
Up until now we've basically been futzing with the search text to get the
results we want. Some of the most
common tweaks to a basic search can be done with a click or two, to drill down
on events of interest, focus on anomalies, or eliminate noise to find the
needle in a haystack. Anytime
after you kick-off a search you can click on the terms or field values in the
search results to add those keywords to your search.
Alternatively,
you can modify your search with fields by using the Fields sidebar (the
smurf-like area to the left of the search results). This area allows you to modify which fields are shown on
results and to add field restrictions to your search. Click on "Pick fields" to open the Fields popup
window, add select which fields show up on your search results. Clicking on a field in the Fields
sidebar will allow you to preview the most common values for a field as well as
select "Show only events with this field" to narrow down the results.
Point-And-Click Report Building
Okay, you've run some searches, and they're pretty cool. But let's see some graphs, damn
it. Let's go back to our main
example search and generate some graphs.
Search for:
status=404
You'll see
a "Build report" link on the right just above the timeline. Click it, to launch the Report Builder.

We're now
on the "Define report contents" page, which lets us set up your
initial report parameters, such as the type of report and the fields that
you're reporting on.
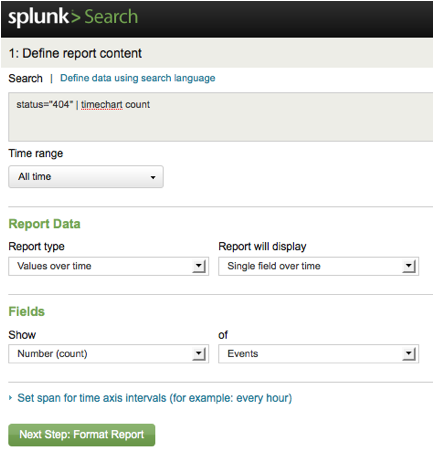
There are
three basic report types to choose from:
· "Values over time" to
chart trends in field values over a selected time range.
· "Top
values" to report on the most common field values.
· "Rare
values" to report on the most uncommon field values.
For now,
accept the defaults (Values over time that count the number of events), by
clicking “Next Step: Format Report”.
Holy
Crap. You've just generated a
graph of 404s errors over time.
Pretty cool.
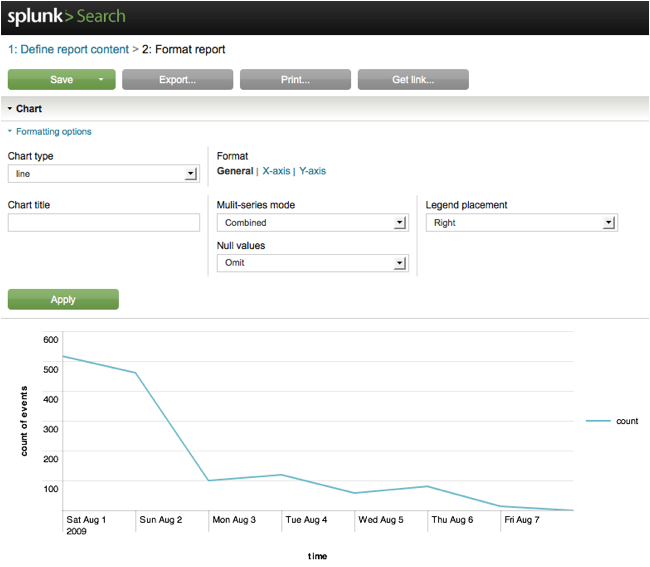
The Format
Report page allows us to fine-tune the chart formatting, and save, print, and
export the results. Play around
with a few settings:
· Change the chart type to column or
area (the Chart Type options that are actually available to you at any given
time depend on the type of report that you've created).
· Give
your chart a title.
· Change
the Y-axis title to refer to “People who Love Police Academy”.
·
Let's go back to define a different report. Click on "Define report content" at the top of the
page.
Change
"Report will display" drop-down to be "Single field split by
another field" and change "split by" to be "uri". What we're saying now, is "show me
that same time chart but split out each uri as a separately graphed line. Click "Next Step: Format
Report" to see the resulting chart.
Go back to "Define report content" and try a few different
other fields. When we use the
"Values over time" report type, we associate a statistical operator
(such as count, direct count, average, mode, median, and so on) with a field
over time. By default it uses
“count”, and we counted the number of 404s over time.
Try the Top Values and Rare Values for the "Report types".
Here's are some examples of various chart times formats: http://www.splunk.com/base/Documentation/latest/User/ChartGallery
Advanced Reporting
We've briefly looked at using the Report Builder to generate basic
reports. More advanced reporting
requires search-language commands and are not currently as simple as
point-and-click. We'll do a
drive-by-shooting of these commands in rapid fire to learn-by-example.
Note: To see the report based on an
example below, run the search and then click on the "Show report"
link on the right just above the timeline.

Time-based Charts
Use the "timechart" reporting command to create charts that display
statistical trends over time, with time plotted on the x-axis of the
chart. Let's plot count of 404s
over time:
status=404 | timechart count
Let's plot the total number of bytes for successful web accesses (status=200)
over time:
status=200 | timechart sum(bytes)
Notice the "sum(bytes)".
The chart, timechart, and stats search commands are all designed to work
with statistical operators, such as count, dc (distinct count), mean, median,
mode, min, max, range, percentiles, standard deviation, variance, sum, first
occurrence, and last occurrence.
We could have easily just used "min(bytes)" to get the minimum
number of bytes over time.
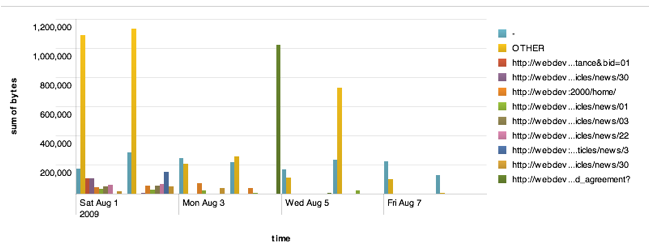
You can optionally split the timechart into different series of values for each
distinct value of a "by" field.
Each referer, let's plot the total number of bytes over time separately:
status=200 | timechart sum(bytes) by
referer
Use the "chart" reporting command to create charts that display any
series of data. Unlike the
timechart command, charts created with the chart command use an arbitrary field
as the x-axis. You use the over
keyword to determine what field takes the x-axis.
Let's calculate the total number of bytes for each day of the week:
status=200 | chart sum(bytes) as
“Total Bytes” over date_wday
In this
example we added the “as” clause which lets you rename the name of a field in a
report. As it is, you’ll get
“Total Bytes” vs. “date_wday”. If
we didn’t have that “as” clause, it would be “sum(bytes)” vs. date_wday. Try renaming your fields after your
favorite Jane Austen novels for a big promotion with the boss.
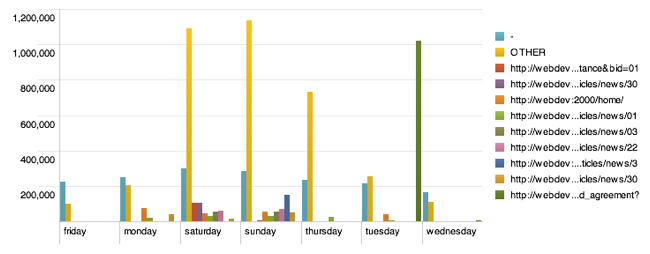
You can
optionally split data by another field, meaning that each distinct value of the
"split by" field is a separate series in the chart. For each referer, let's plot the total
number of bytes for each day of the week separately:
status=200 | chart sum(bytes) over
date_wday by referer
Use the top and rare reporting commands to create charts that display the most
and least common values of fields.
Let's find the top 5 referers for 404 web pages -- in other words let's find people that point to bogus pages on our website. When you run this report, try changing the Chart Type to a
pie chart.
status=404 | top 5 referer
Of the 100 rarest valid web pages, let's those that have been accessed more
than once:
status=200 | rare 100 uri | search
count>1
Use the stats reporting commands to generate reports that display summary
statistics. Let's get the total
bytes downloaded as well as the max bytes for any page access:
status=200 | stats sum(bytes),
max(bytes)
We can add a splitting "by" clause to break out values by
referer. We can then see if the
biggest download came from someone directed to us by google or by zombo.com:
status=200 | stats max(bytes) by
referer
If you’ve got to this point, you should really be impressed
now. You should really be smitten
with Splunk. You’ve taken some
data, searched it, generated reports, and produced charts. While you did this over a small sample
of web events, as I said at the beginning of this section, you should try it
with your own data. There’s
nothing quite like the feeling of looking at the same data you’ve been staring
at for years, but with new bionic eyes and arms.
When you try Splunk on your own data, perhaps you may
find it has not automatically extracted out some fields that you’d like it
to. By now you should see the
value of fields for generating reports – you can’t calculate the sum of bytes
per webpage, if Splunk hasn’t extracted out the bytes and uri fields from your
event text.
This chapter will help you teach Splunk how to extract
fields for you. You should also
note that this learning can be done after you index your data. Splunk is always able to learn and get
smarter, so you’re not suck with data in the crappy state it was in when you
first showed it to Splunk.
At search time, Splunk extracts fields from the event
data, looking for obvious field name/value pairs (e.g.,
"user_id=jdoe") and also matching user-defined extraction patterns,
which use regular expressions.
You can create your own fields, extracted by your own
extraction patterns. While you can
create these extraction patterns manually, there is a much simpler method. Splunk's Interactive Field Extractor
(IFX) allows you to train Splunk to automatically extract fields, given just a
few example values.
Let's work through an example and extract out a new
"timezone" field.
1) Perform a search:
source=*websample.log
On each event notice the "-700", which is the
timezone offset (i.e., 7 hours earlier than GMT).
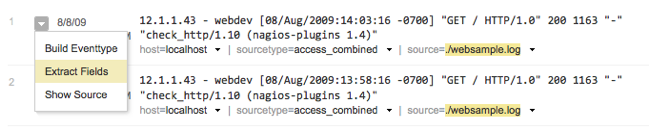
2) To the left of each search event's timestamp is a
dropdown UI control with a little triangle. Click on it, and select "Extract Fields". The IFX interface pops up.
3) Under "Example values", enter
"-0700", and click "Generate".
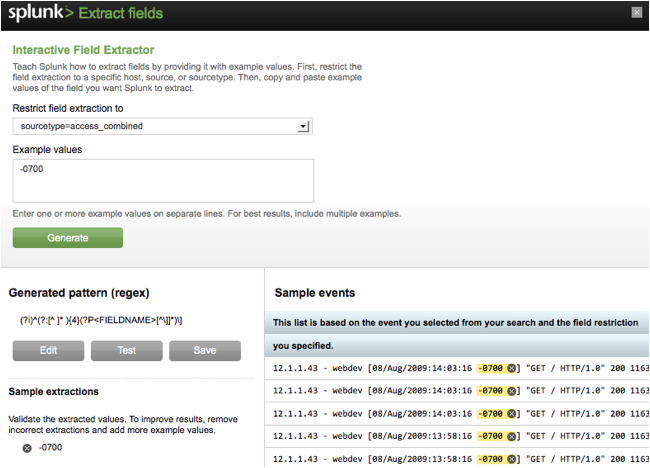
4) If all goes according to plan, the IFX will have
generated an extraction pattern (shown under "Generated pattern") and
under "Sample extractions" you can verify that "-0700" was
extracted properly.
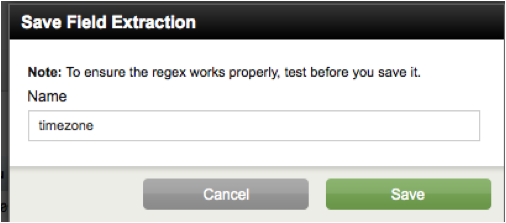
5) Click "Save" and a dialog pops up, allowing
you to specify the field name as "timezone". Click Save.
6) Click "Close" to close the IFX.
7) In the search window, rerun the search from step 1.
8) Your
newly extracted field "timezone" is now being extract, but you can't
see it yet. In the blue smurf-like
area on the left, click on "Pick fields" and then add
"timezone" to the list of selected fields. Click "Save".
9) Now you can see your events have a
"timezone=-700" attribute!
Were this field more interesting you might want to report on the top
timezones:
status=200 | top timezone
Additional Exercises
Go back to step 2, and rather than trying to extract the
timezone based on "-700", enter "200", which is a common
http status code for "things didn't seem to screw up". You'll get a warning that "the values
you want are already extracted in the 'status' field.” This is correct. There's no reason to extract the http
status code yourself, Splunk is already doing it. Go back to step 2, and rather than try to extract other
fields.
Afterwards, return to the search window, and in the upper
right corner, click on Manager, then Fields, and then "Field
extractions". Here you can
add, modify, delete, and share field extraction patterns.
This
section is only for the over-achievers, who want to know more about the Splunk
concepts that we only briefly alluded to before. I had to write this for you, rather than playing Zelda. I hope you’re happy. May you go hunting with Dick Cheney.
An event is a
single entry of data. In the
context of log file, this is an event in a Web activity log:
173.26.34.223 - - [01/Jul/2009:12:05:27 -0700] "GET
/trade/app?action=logout HTTP/1.1" 200 2953
More specifically, an event
is a set of values associated with a timestamp. While many events are short and only take up a line or two,
others can be long, such as a whole text document, a config file, or whole java
stack trace. Splunk uses
line-breaking rules to determine how it breaks these events up for display in
the search results.
A source is the
name of the file, stream, or other input from which a particular event originates, for example
/var/log/messages or UDP:514. Sources are classified into sourcetypes, which can either be well
known, such as access_combined (HTTP Web server logs), or can be created on the
fly by Splunk when it sees a source
with data and formatting it hasn't seen before. Events with the same sourcetype can come from different sources -- events from the file /var/log/messages and from a syslog input on
udp:514 can both have sourcetype=linux_syslog.
A host is the
name of the physical device where an event
originates. Host provides an easy
way to find all data originating from a given device.
When you add data to Splunk, Splunk processes it,
breaking the data into individual events,
timestamps them, and then stores them in an index,
so that it can be later searched and analyzed. By default, data you feed to Splunk is stored in the
"main" index, but you can
create and specify other indexes for
Splunk to use for different data inputs.
fields are searchable
name/value pairings in event
data. As Splunk processes events at index time and search time, it
automatically extracts fields. At
index time, Splunk extracts a small set of default fields for each event,
including host, source, and sourcetype. At search time, Splunk extracts what
can be a wide range of fields from the event data, including user-defined
patterns as well as obvious field name/value pairs such as user_id=jdoe.
Tags are
aliases to field values. For example, if there are two host
names that refer to the same computer, you could give both of those host values
the same tag (e.g.,
"hall9000"), and then if you search for that tag (e.g.,
"hal9000"), Splunk will return events
involving both host name values.
Eventtypes are
cross-referenced searches that categorize events
at search time. For example, if
you have defined an eventtype called
"problem" that has a search definition of "error OR warn OR
fatal OR fail", any time you do a search where a result contains error,
warn, fatal, or fail, the event will have an eventtype field/value with
eventtype=problem. So, for
example, if you were searching for "login", the logins that had
problems would get annotated with eventtype=problem. Eventtypes are
essentially dynamic tags that get attached to an event if it matches the search definition of the eventtype.
The search language
is the language that Splunk understands to run a search (i.e., query).
Generally a search involves a
search against indexed data and optionally some data processing commands. Commands are separated by a pipe
("|") character. For
example, the search:
error sourcetype=access_combined | top
uri
will retrieve indexed weblog events from disk, which contain the term "error", and
then for those events, report the most common URI values.
Search results with formatting information (e.g., as a
table or chart) are informally referred to as reports, and multiple reports
can be placed on a common page, called a dashboard.
Apps can be as
simple as a set of eventtypes, saved searches, and reports, or can be as complex as an entirely new program using
Splunk's API. Apps allow you to build different environments that sit on top of
Splunk. You can have an app for troubleshooting email servers,
one for web analysis, and so on.
By default, Splunk comes with a few apps. The Search App,
the main interface for generic searching and reporting, is what you'll use 99%
of the time, unless you have a specific app more targeted for your tasks. The Getting Started App (check it out
after finishing this document) introduces new users to Splunk's features. There are also OS-specific Apps, such
as Windows or Linux, which provide reports
and pre-built searches. If you want to change the App you're
in, select a new one from the App drop-down menu at the top right.
Saved Splunk objects, such as savedsearches, eventtypes,
reports, and tags, enrich your data, making it easier to search and
understand. These objects have permissions and can be kept private or
shared with other users, via roles (e.g., "admin",
"power", "user").
A role is a set of
capabilities that you can define, like whether or not someone is allowed to add
data or edit a report. Splunk with
a Free License does not support user authentication.
A transaction
is a set of events grouped into one event
for easier analysis. For example,
given that a customer shopping at an online store would generate web access events with each click that each share a
SessionID, it could be convenient to group all of his events together into one transaction. Grouped into one transaction
event, it's easier to generate
statistics like how long shoppers shopped, how many items they bought, which shoppers
bought items and then returned them, etc.
A forwarder is
a version of Splunk that allows you to send data to a central Splunk indexer or
group of indexers. A light
forwarder is a lightweight version of
a forwarder with more limited
capabilities. An indexers, or index servers, provide
indexing capability for local and remote data.